Tonga
TONGA: A major M 7.0 suspected 'foreshock' occurred on Mar 30 this year, and only some 14 km SE of the previous M 8.0 in 2006. This possible foreshock is also shown on the Google Earth Pro map below.
The official position is that this M_7.0 cannot be determined as a foreshock until after the mainshock has occurred. The USGS says that “Foreshocks are earthquakes that precede larger earthquakes in the same location. An earthquake cannot be identified as a foreshock until after a larger earthquake in the same area occurs.” [Foreshocks, aftershocks - what’s the difference? | US Geological Survey.]
However, according to this new ecological theory and a wide regional approach to forecasting, principal 'foreshocks', not defined as above, but rather as regional seismic events which are about one magnitude less than a subsequent mathematically-determined mainshock are potentially identifiable, often up to a few years ahead of the mainshock. Thus, with reference to Fig. 1, at the end of 2022 the mainshock model was already forecasting a M_7.85 , and by the end of 2024 this model was forecasting an approximate M_8.1 mainshock, which timing models expect in 2026.
With this above scenario, it was expected and not surprising to have a M_7.0 ‘potential foreshock' in March this year, only some 14_km SE of the previous mainshock of M_8.0 in 2006.
The worldwide mainshock model (determined mathematically from a hundred sequences of annual seismic events like that shown in Fig. 1) forecasts a magnitude (M) 8.1 mainshock, but now the big question is When? Later this year, or next year?
Only long-term models for the yearly timing of largest seismic events can provide the answer – if it is indeed the correct year for the expected mainshock, then the following short-term models come into play.
These short-term timing models are based on lunar monthly, and also weekly patterns and daily models, which are updated regularly as new seismic events occur. Then, triangulation between various models (based on the important arithmetic, algebraic, and geometric parameters of the timing models) answers the question of ‘when’ to within plus or minus one day of the main event in 95% of cases.
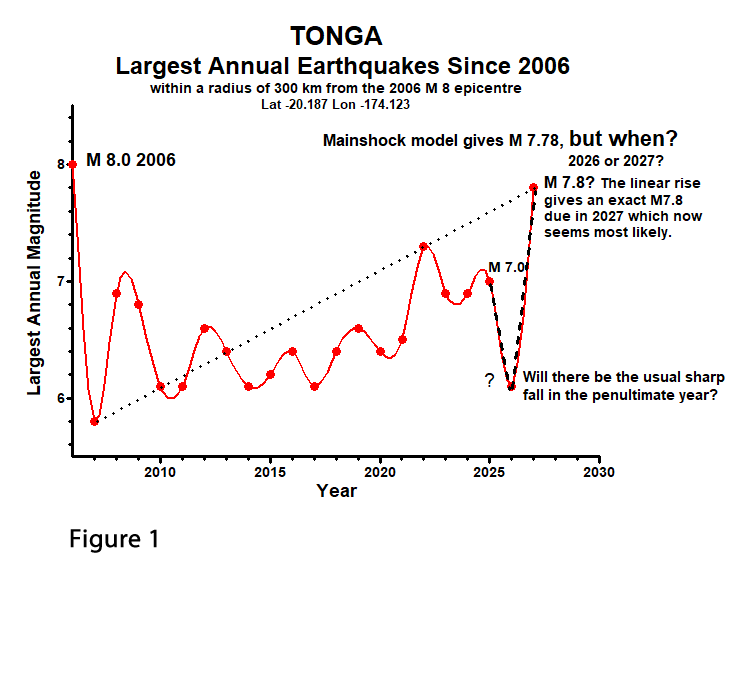
Fig. 1.
Will this graph rise or fall in 2026?
Models for forecasting are based on the critical spatial and temporal patterns of past events, so to help answer the above question various comparative studies are currently being pursued, such as comparing the earthquake patterns in Figs 1-2, with more comparisons to be added to the website soon. Prior to the 2006 M 8.0 a strong drop in the magnitude occurred in this Tongan region (Fig. 2). There is usually a strong drop in magnitude for the year prior to a mainshock and this has not happened yet so it may happen this year (as suggested in Fig. 1) with the expected mainshock not coming until 2027.
This kind of graph is closely similar in format and concept to those of my previous career as an insect ecologist where, instead of the largest earthquake in a given time period, I was studying the maximum abundance of certain insect species each year as a result of different pasture grazing management practises. This simple approach led to a worldwide breakthrough which overturned conventional thought and expectations and made it possible to understand several previous conundrums in the dynamics of pasture pest problems throughout the world.
Well might you have asked: ‘What have insects to do with earthquakes?’ Nothing. and ‘What have earthquakes to do with insects?’ Nothing. Certainly not in this context here. But the ways an ecologist might go about modelling their population dynamics and features of their ecology are very similar.
Previous retrospective forecast for M_8.0, 2006
This new ecological forecasting model gave the exact magnitude and date (May 3) for this event which was expected within 250 km of Pangai, Tonga. It occurred only 45 km SE of Pangai.
*If not stated otherwise, all earthquake data for the research and forecasts shown in this website were derived from the United States Geological Survey (USGS), and all times and dates are UTC.
This event is certainly imminent, but when?
(answered via the author’s specialised timing models)
Now likely about May 1, 2026 (Revised 6-03-26)
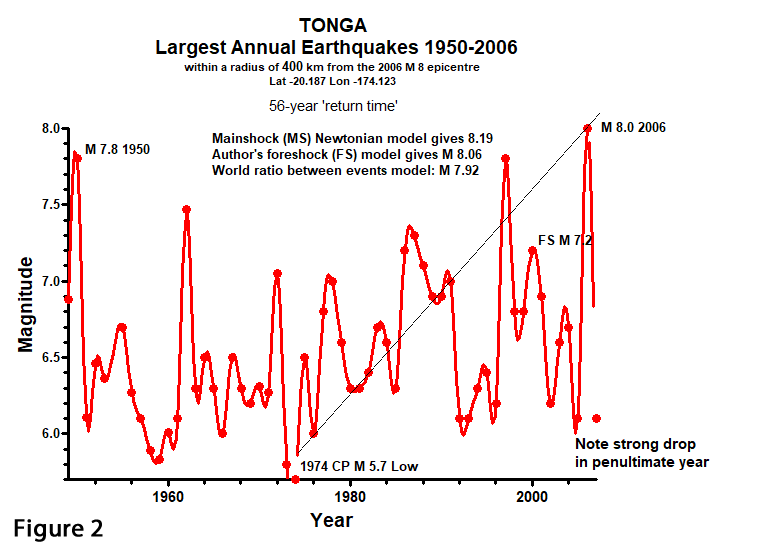
Figure 2 illustrates these important points:
The author's 'mainshock model' is very robust, yielding a remarkably close estimate for the magnitude of the 2006 Tongan event despite the erratic content in the size of events throughout this sequence where the value of every point (as for all sequences) plays its part in the modelling which is based on Newton's third law that for every action there is an equal and opposite reaction.
The lowest yearly value in the sequence - the M 5.7 in 1974 - is the author's mathematical 'Critical Precursor' (CP) in terms of modelling based on the Newtonian principle above.
The Critical Precursor is both mathematically and spatially important. Not surprisingly, it also occurs close to the coordinates of the forthcoming mainshock - usually within 250 km. In this example, and with this search zone having a radius of 400km, the CP occurred only 125 km southwest of the M 8.0 mainshock.
The Critical Precursor usually lies at the divide between aftershock and foreshock sequences - trends which can be described with linear regressions like the one fitted visually to the bottoms of the rising curves in Figure 2. This rising trend should agree with other modelling outcomes for the expected value of the next mainshock in 2006, and it does: linear regression here gives M 8.00 (P< 0.0001, R2= 0.889).
A strong drop in magnitude in the penultimate year is the norm and is well illustrated here.
Further information regarding the M 8.0 event of May 3, 2006, -is available on the USGS network: M 8.0 - 47 km SSE of Pangai, Tonga: “At the location of the earthquake, the Pacific plate subducts westward beneath the Australia plate at a velocity of about 77 mm/yr”. This USGS site also says that a tsunami with wave height of 0.54 metres hit at Pago Pago, and that this peak was also reached at Crescent City, California. Fortunately, no loss of life was recorded, and only one person was injured.
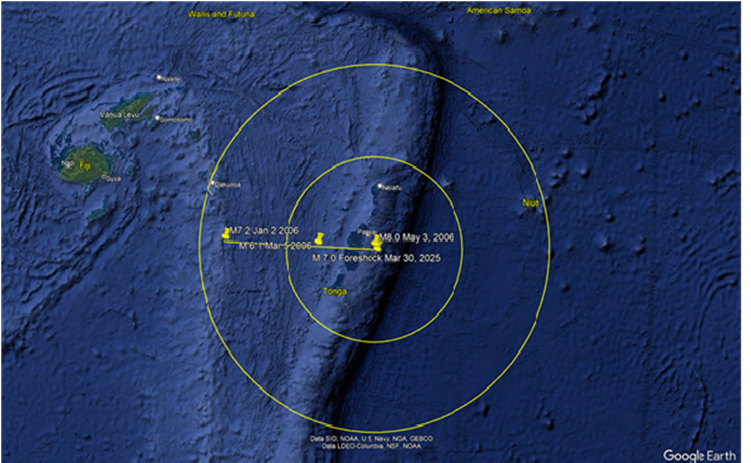
Google Earth Pro map updated on 16-08-2025, showing major ‘foreshocks’ to M_8.0, 2006, with circles of radii 250 km and 500 km centred on the M_8.0 epicentre. This image includes the M_7.0 ‘foreshock’ of Mar 30, this year (2025). This update shows the M 5.5 of Aug 14 at 156 km ENE of Neiafu, Tonga. [USGS Earthquake Map, with the aforementioned earthquakes indicated on Google Earth Pro by the author] https://earthquake.usgs.gov/earthquakes/map/
**Data were analysed with a spline curve generated using GraphPad Prism version 5.01 for Windows, GraphPad Software, San Diego, California USA, https://www.graphpad.com