The Mainshock Analytical Module

Developed by R.J. Roberts, Multidisciplinary Ecologist
Summary
This document details the development and use of the Mainshock Analytical Module, a tool that forecasts the magnitude of significant earthquakes worldwide by identifying mathematically defined critical precursors (CPs). The module is based solely on analyses of the largest event each year and within that framework the module works by isolating the lowest annual seismic events occurring between mainshocks and converting these magnitudes into regionally normalised indices. Through this method, the author has established a robust linear regression model connecting CP indices to mainshock indices. This approach allows for the prediction of mainshock magnitudes at least a year in advance, with accuracy exceeding 95% and a margin of error within ±0.2 magnitude. An explanation of the methodology is provided, along with a comprehensive case study focused on Tonga.
The Discovery and Application of Critical Precursors
Over more than twenty years, the author conducted an in-depth study of over one hundred of the world’s most significant mainshocks, basing the research summary below exclusively on his own work. Through this research, a mathematically critical precursor (CP) for mainshock earthquakes was identified. This CP is defined as the lowest point (or coequal point) among the largest annual earthquakes that occur between recurring mainshocks, as illustrated in Figure 2 of the separate chapter on Tonga forecasts. These precursors vary depending on the geological and seismological context of each region and inter-mainshock period. To address these differences, the author reports the earthquake magnitudes as indices, which capture key regional parameters. By minimising the effects of local geological and seismological variations, this approach allows the analytical module to be applied globally for earthquake forecasting.
Statistical Correlation and Predictive Modelling
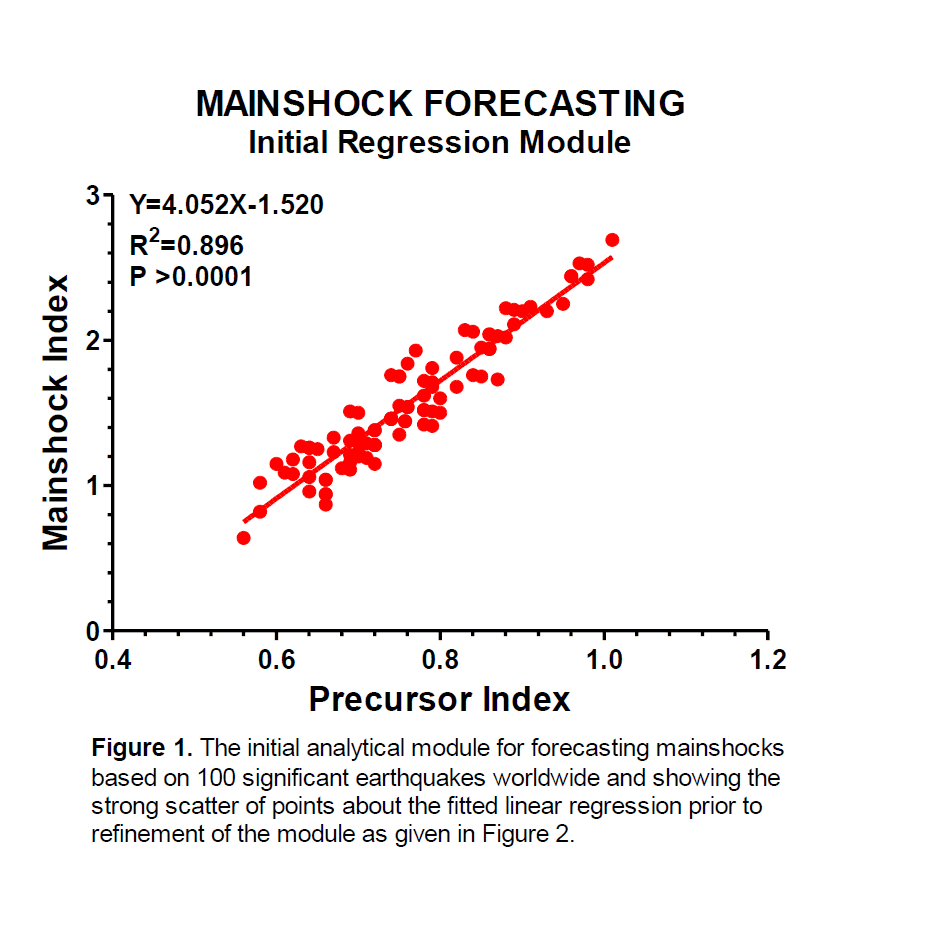
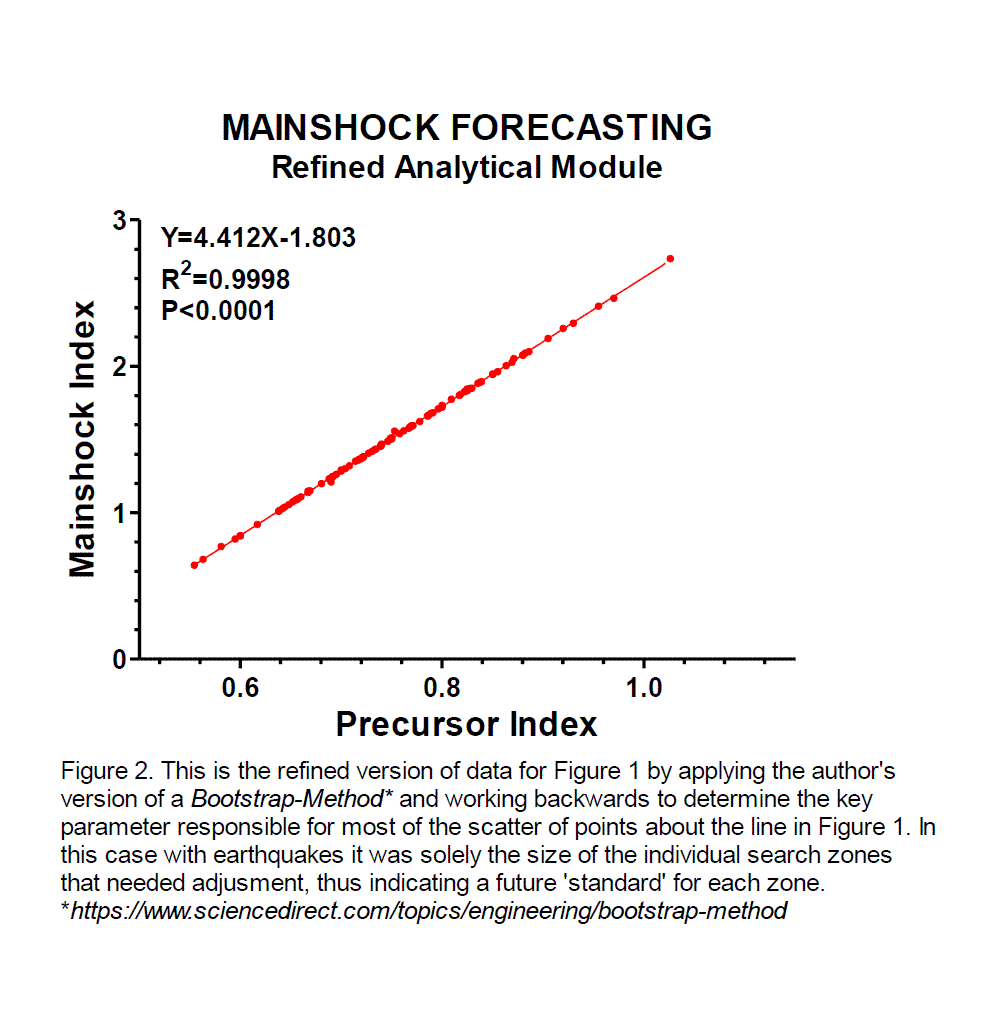
Figures 1-2 below demonstrate a highly significant linear correlation between indices for critical precursors and indices for the size of their subsequent mainshocks, with the refined Figure 2 accounting for 98.98% of the variability observed in the data. This linear regression encompasses major earthquakes from one hundred regions worldwide, covering the entire spectrum of mainshock magnitudes, including magnitude nine mega earthquakes. The author has applied this linear equation in various contexts, both retrospectively and prospectively, to forecast the magnitude of forthcoming mainshocks at least one year in advance. This method has demonstrated an accuracy exceeding 95% within a ±0.2 magnitude range.
Example Analysis Using Critical Precursors
As an example, the 55-year sequence of events between mainshocks within a 400 km radius zone in Tonga shows that the largest annual events reached their lowest point in 1974, when the largest event was magnitude 5.7. The author refers to this significant low as the 'critical precursor' (CP), which, when subtracted from the average yearly magnitude (M 6.493 - 5.7 = 0.793 CP Index for Tonga), forms an index of decreases below the average level. This 'CP index' is highly correlated with the 'Mainshock Index', which measures deviations above the average. This strong correlation enables the size of a future mainshock to be calculated using a straightforward linear equation, as detailed in Figure 2.
The Linear Regression Equation for Mainshock Prediction
Using data from over one hundred significant earthquakes worldwide, the author developed a linear regression equation, shown in Figure 2, which enables highly accurate predictions. This equation demonstrates how the parameters discussed vary with mainshock magnitude: The equation is Y = 4.412X – 1.803 ©, where Y is the index estimating how much the next mainshock will exceed the region’s average yearly magnitude, and X is the CP index, the difference between the CP magnitude and the mean level of the largest yearly magnitudes between mainshocks. The regression slope is –1.803.
Importantly, the final analysis step requires the researcher to add the Y-index to the average (or mean) of the largest yearly events. This sum provides the estimated magnitude of the expected mainshock in the analysed region.
For example, Tonga experienced a magnitude 8.0 earthquake in May 2006. Five months prior, retrospective analysis using the above equation indicated the mainshock’s strength would likely be M 8.19. Using the formula Y = 4.412 × 0.793 (CP) – 1.803 results in 1.616, which, when added to the average yearly magnitude of M 6.493, yields a predicted mainshock magnitude of M 8.19—very close to the actual event, and calculated months before its occurrence.
[Please see two graphs below]
Copyright © 2004-2026 RJ Roberts. All rights reserved.