Mainshock Ratio Module:
Analytical Development and Application
Modelling Approach and Caveats
The method relies on comparing ratios of seismic events preceding mainshocks. However, it is important to note that, in the absence of other models, these ratios do not necessarily indicate that a mainshock is imminent. There are specific caveats: the approach does not apply to large foreshocks, aftershocks, or events associated with them. Such occurrences must be avoided when calculating ratios for mainshock prediction. For example, Cape Mendocino’s M 7.0 data (Figure 1) were derived from only the previous nine months to exclude a major foreshock.
Model Requirements and Consistency
This module serves as the standard against which future events must be assessed if realistic forecasts are to be made. Notably, the slope for Californian events remained largely unchanged even after incorporating data from other regions worldwide. Detailed records of these zones yet to be made available in a future submission.
Overview of the Mainshock Ratio Module
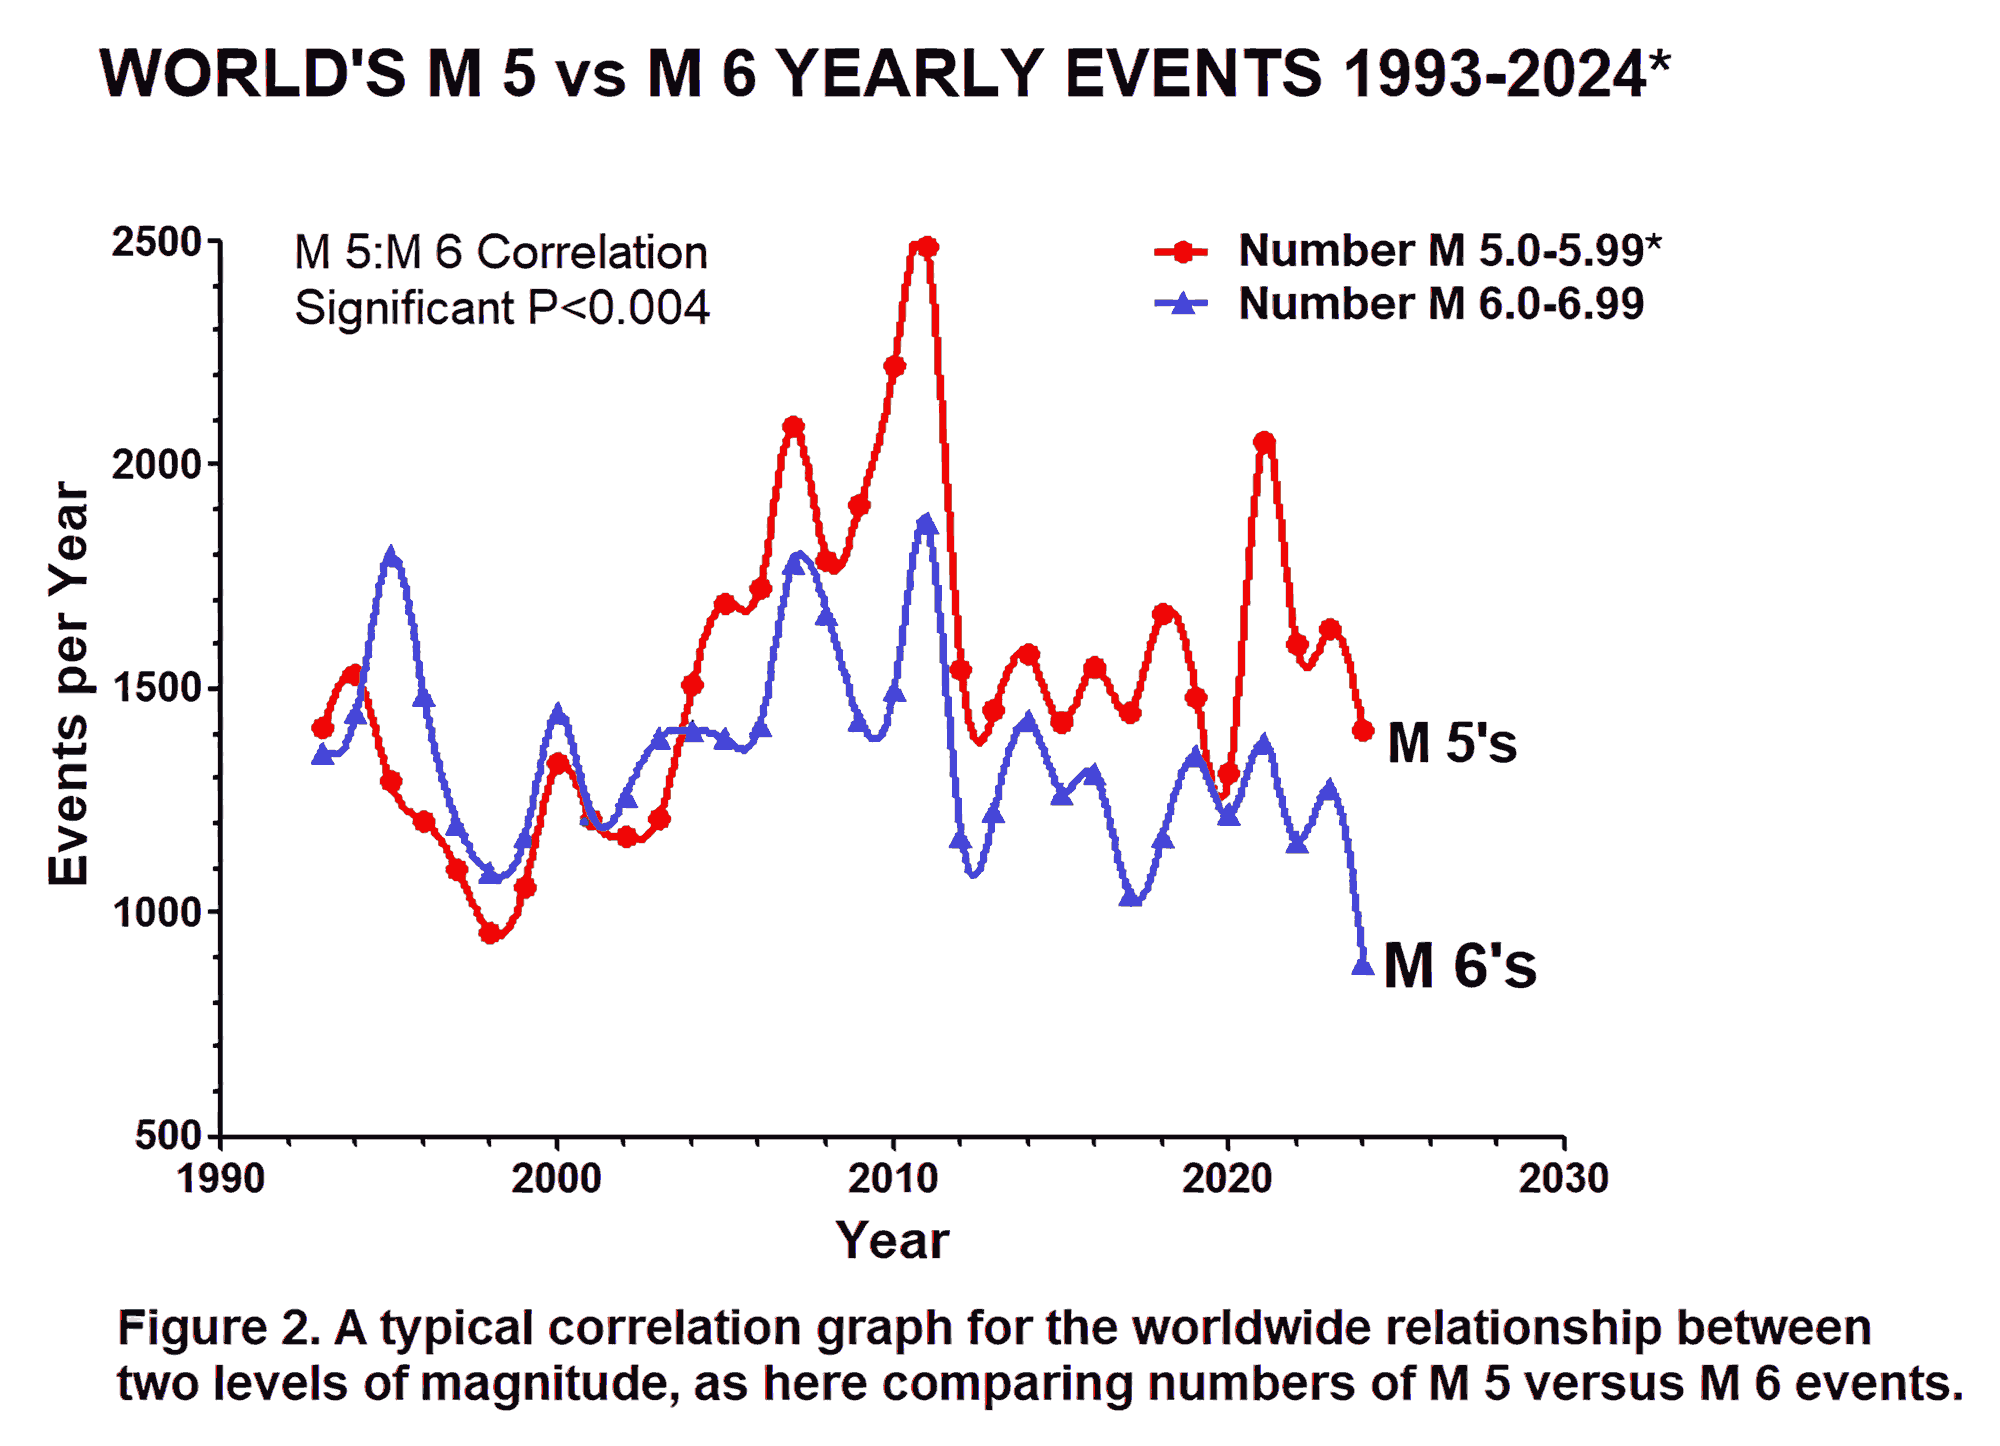
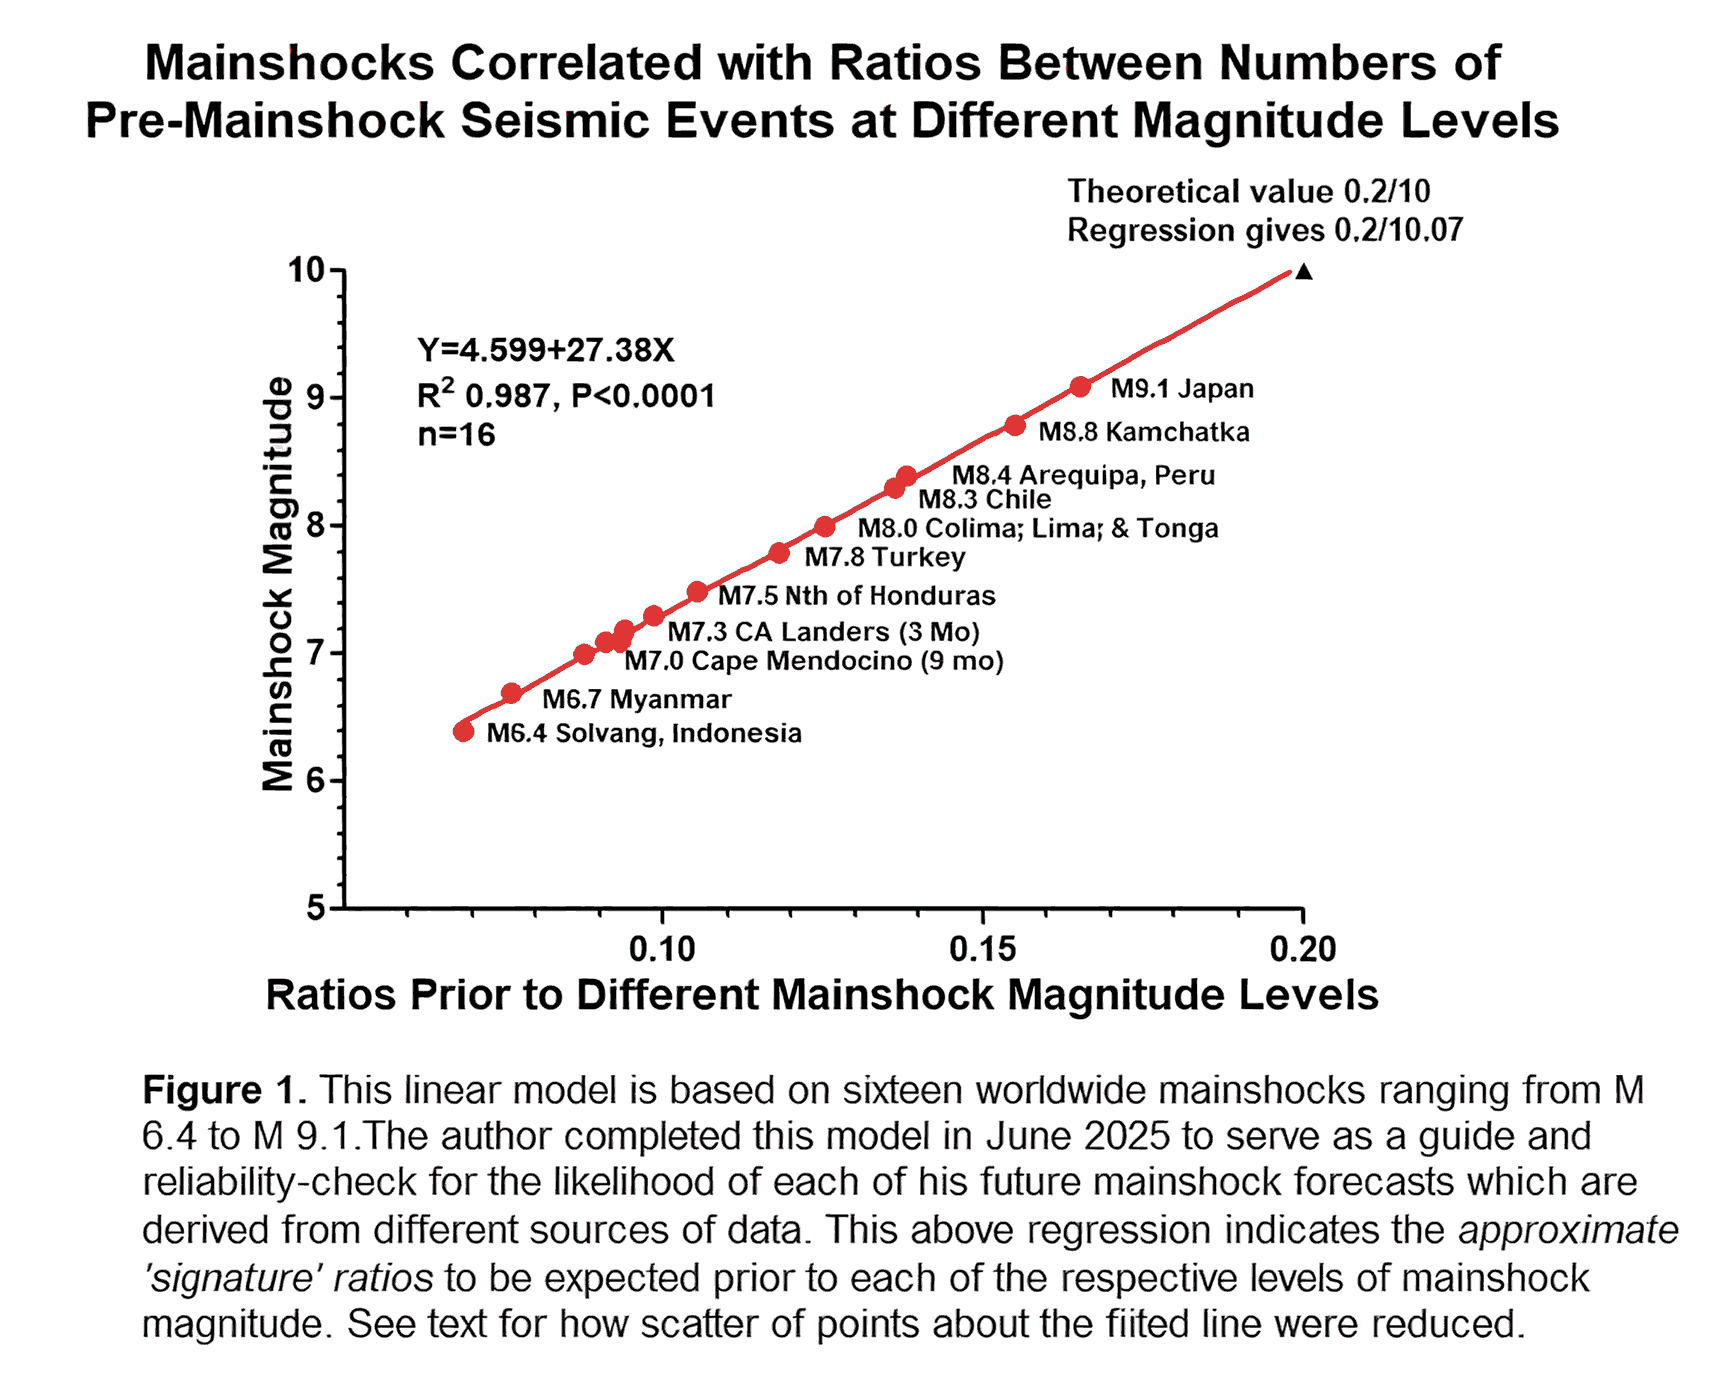
In early 2025, the author identified strong correlations between the frequency of seismic events at different magnitude levels across large regions globally (Figure 2). This observation led to further research into how event ratios relate to the magnitude of impending mainshocks. The resulting linear correlation (Figure 1) provides an independent estimate for the size of a forthcoming mainshock, which serves as a check on other forecasting methods. The equation for this linear correlation is:
Y = 4.599 + 27.38X
where X is the derived ratio and Y is the resolution of the equation.
The “Mainshock Ratio Module” assesses ratios between different magnitude levels, for a relatively short period of less than two years preceding a likely forthcoming mainshock, whereas the principal “Mainshock Analytical Module”, described in another chapter, analyses the largest yearly events since the previous mainshock to develop a forecasting model.
The principal function of this Mainshock Ratio Module, discussed here, is to determine from using this modelling whether a region’s seismological activity is sufficient to support—or at least make possible—a forecast of a particular mainshock. However, a specific ratio does not guarantee that a mainshock will occur; it only indicates the possibility.
Development and Application
Figure 2 illustrates the strong correlation between M 5 and M 6 events globally from 1993 to 2024. Subsequent investigations into correlations between different magnitude levels revealed how these relationships shift relative to the size of a forthcoming mainshock, resulting in the highly significant linear correlation shown in Figure 1. The ratios used are based on counts of M 3/2 for California, M 5/4 elsewhere in the world, or means of M 5/4, 6/5, and 7/6 as detailed in the text.
The linear model was refined using the author’s version of a Bootstrap-Method*, working backwards to pinpoint the parameter responsible for most of the previous scatter of points about the line in Figure 1. For earthquakes, this was solely the size of the individual search zones, which now define a future standard for each zone, to be specified separately.
Data for most zones are drawn from areas of at least 500 km radius over one to two years, with several caveats. Large foreshocks and aftershocks from previous mainshocks must be avoided—sometimes requiring data from periods of only six to nine months. Spurious results may occur if ratios yield a magnitude 10 or any magnitude foreign to the region. These anomalies are under investigation, but the separate Mainshock Analytical Module provides a robust benchmark for the expected size of a mainshock (not its timing). Checking current ratios allows assessment of whether seismicity levels can support the forecast mainshock’s timing as indicated by other models.
Specific zones are yet to be detailed on an attached data sheet. The module’s final formulation was completed in the last week of June 2025.
*https://www.sciencedirect.com/topics/engineering/bootstrap-method